3 Key Ways OpenAI GPT-4o Enhances Crypto Analysis
GPT-4o Revolutionizes Predictions, Data Processing, and Technical Analysis for Crypto Traders
Last year, I wanted to use ChatGPT to profit in the secondary market.
The Motley Fool surveyed 2,000 Americans about using ChatGPT for stock picking. They found that 47% of Americans use ChatGPT for stock information. Interestingly, 77% of high-income Americans had tried using ChatGPT for stock recommendations.
I attempted a similar experiment for fundamental analysis and faced two challenges:
1. Data could not be imported directly and needed processing before import.
2. It couldn’t access the internet, so it used outdated data.
Now, with the release of GPT-4o, the performance is incredibly strong, beyond imagination. Let’s take a look together.
1. Technical Analysis Based on Chart Screenshots
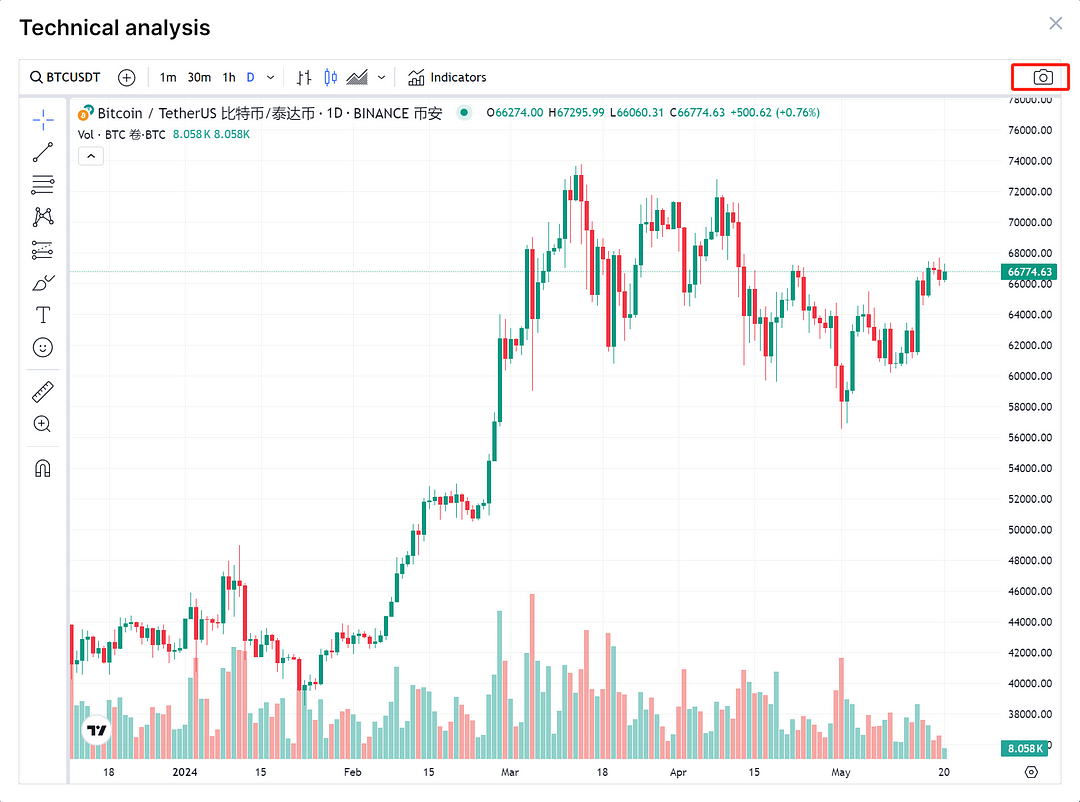
Select a Cryptocurrency Chart: Choose a cryptocurrency chart and copy it.
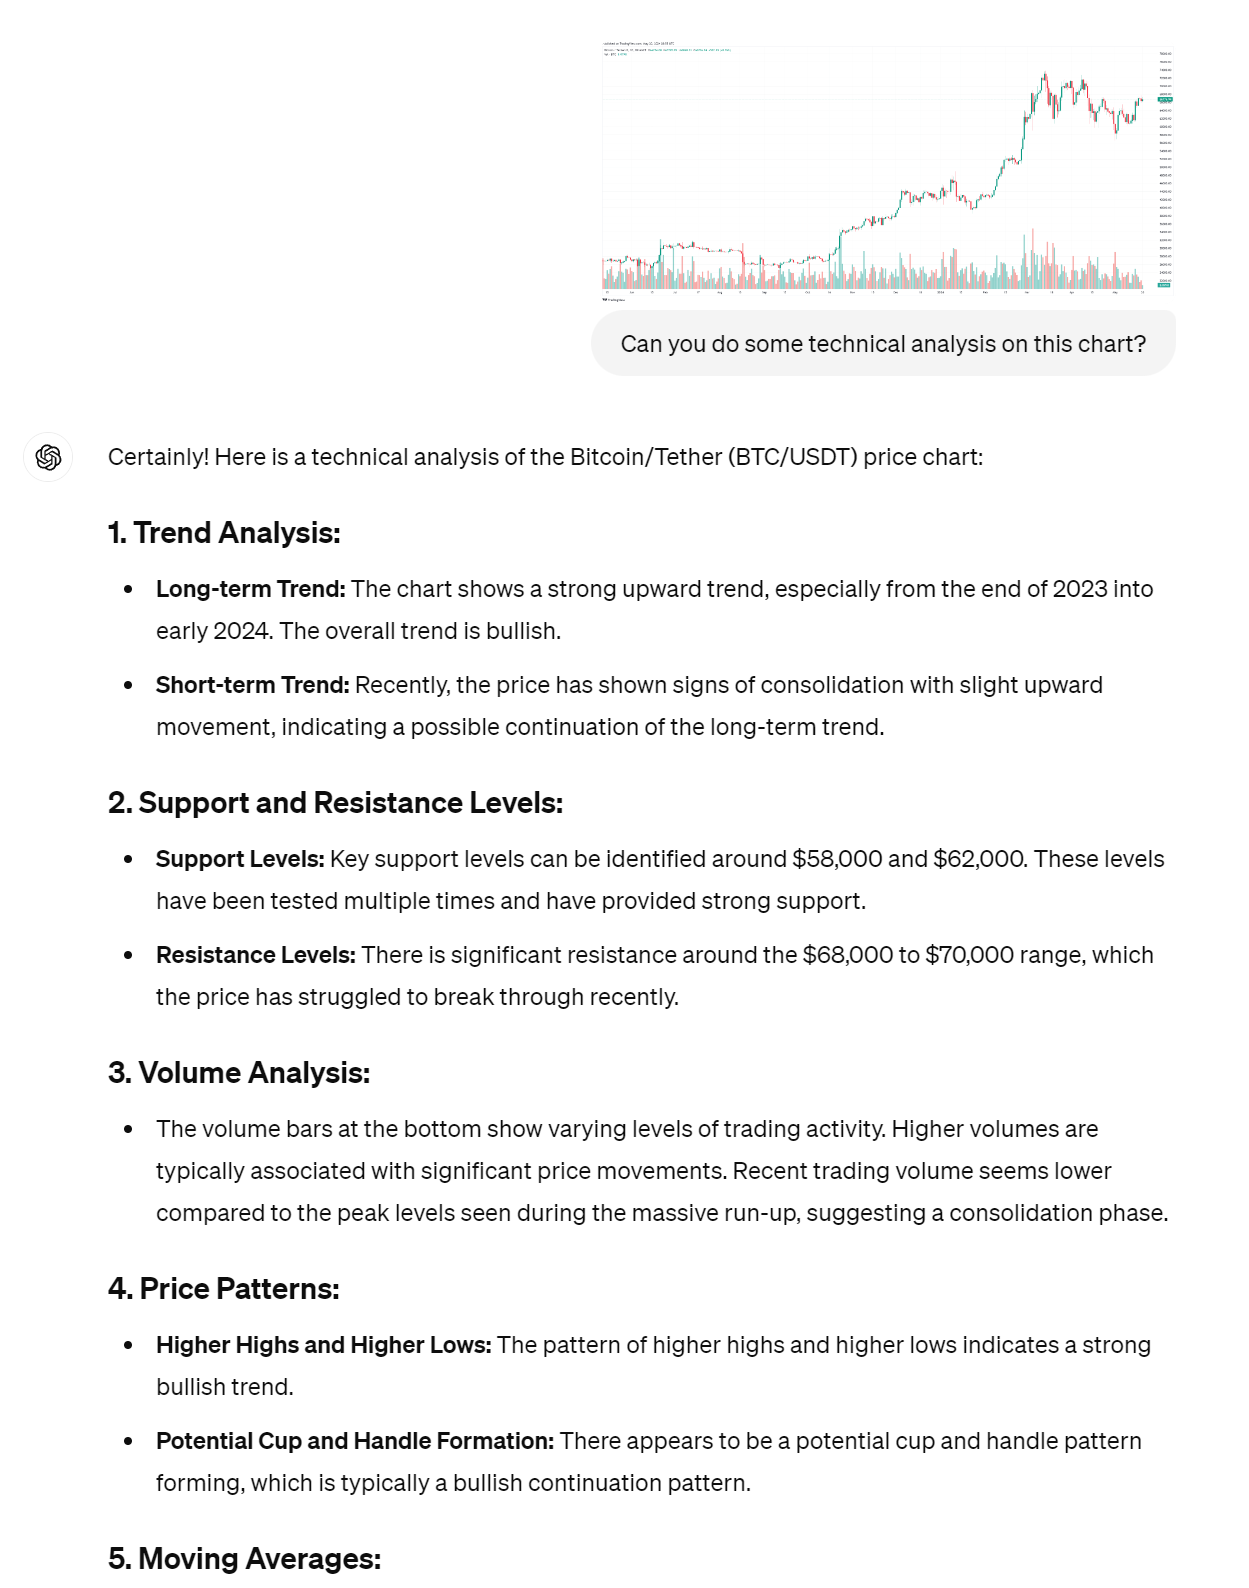
Upload to GPT-4o: Paste the image into GPT-4o and briefly describe the issue.
Summary of Analysis:
• Bitcoin has been going up for a long time. From late 2023 to early 2024, it went up a lot. Recently, it has been staying at a high price without much change.
• The key support price is $58,000. Bitcoin has tested this price many times but has not gone below it. The resistance price is $68,000-$70,000. Bitcoin has tested these prices many times but has not gone above them.
• When there is a lot of trading, the price goes up a lot. Recently, there has been little trading. This means the market is waiting to see which way the price will go next.
• The chart shows that after the price goes down, it goes back up to a higher low price. It also goes up to higher prices. This shows an upward trend. The price might stay in a range for a little while.
• Moving averages can help show the trend. The 50-day and 200-day moving averages are useful for this. Indicators like RSI can show if the price is too high or too low compared to recent prices.
Bitcoin's strong uptrend continues, but the market is waiting for new catalysts. Investors should watch the support and resistance levels and volume changes.
2. Want to Do Some Real-Time Data Analysis?
To analyze data, copy the quarterly report into GPT-4o.
Ask these two questions:
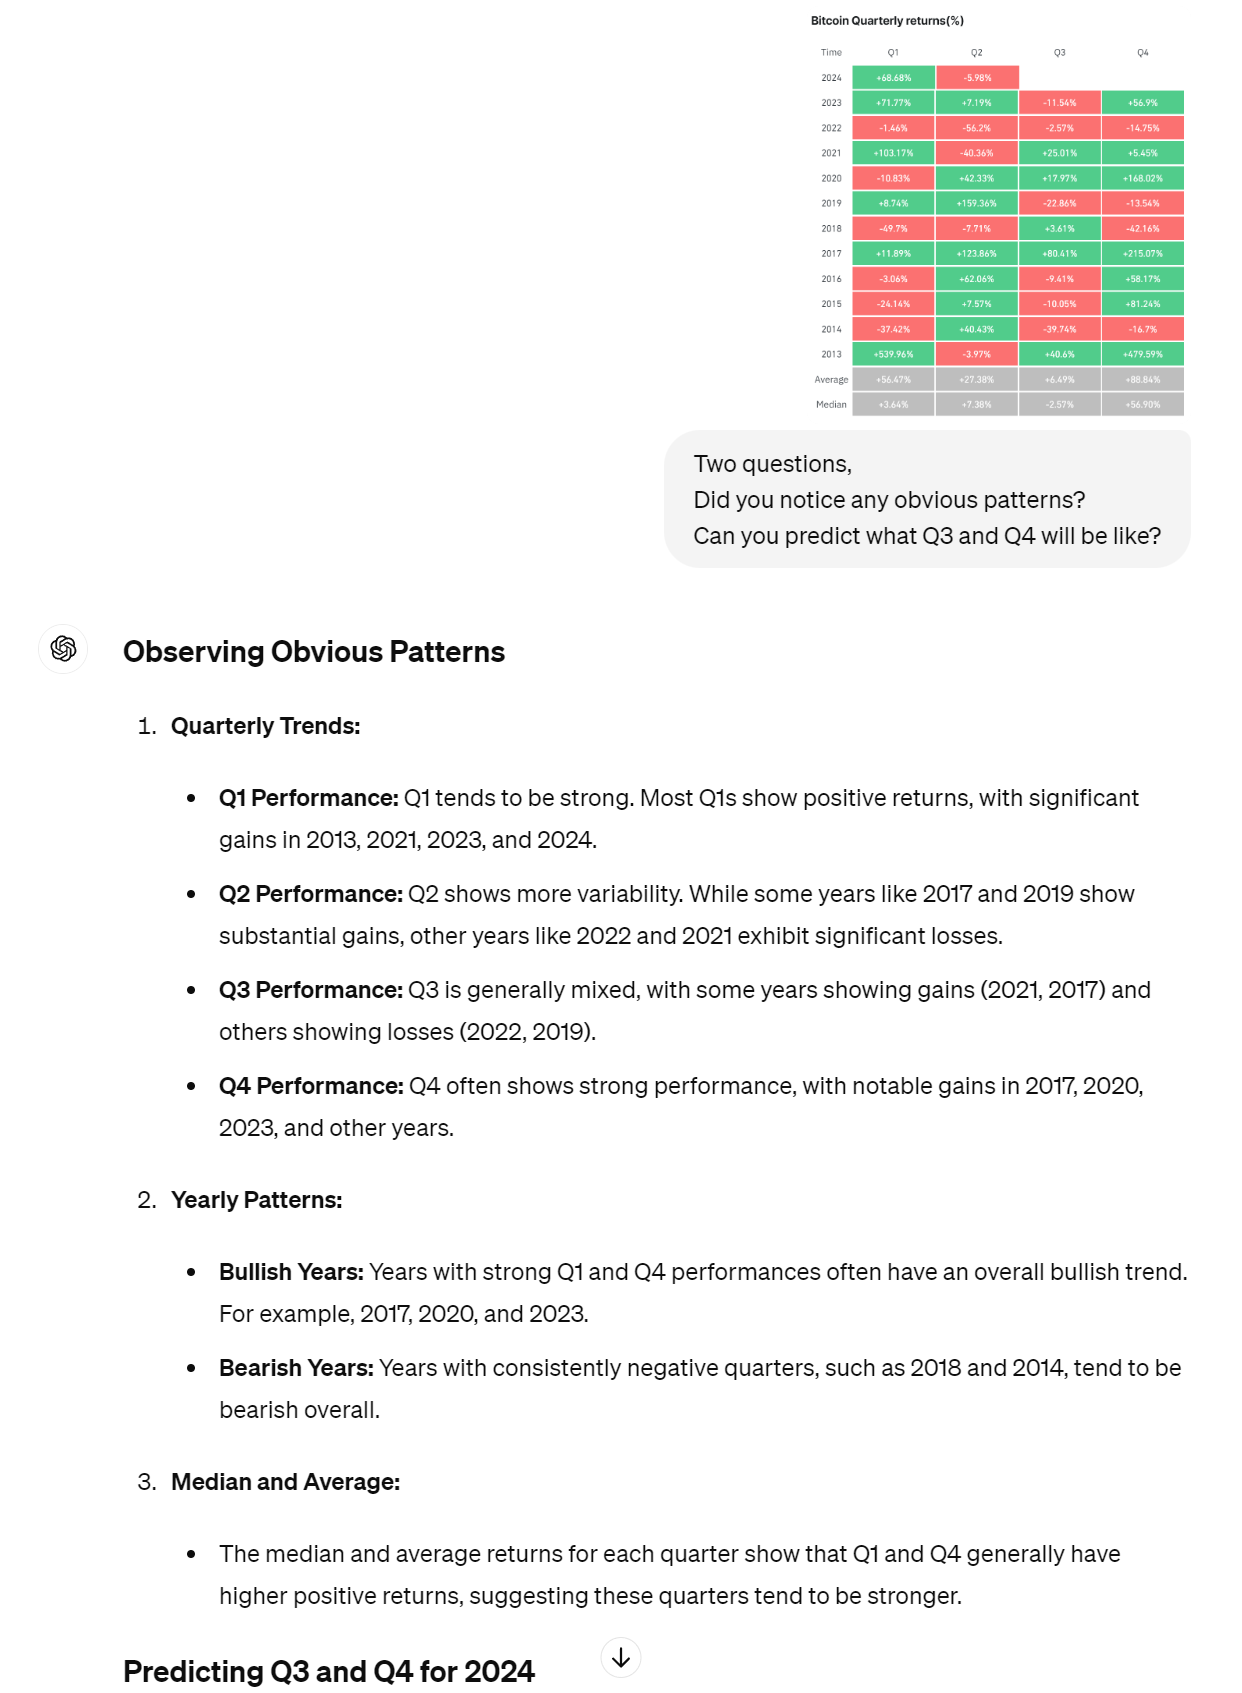
1. Do you notice any obvious patterns?
2. Can you predict what Q3 and Q4 will be like?
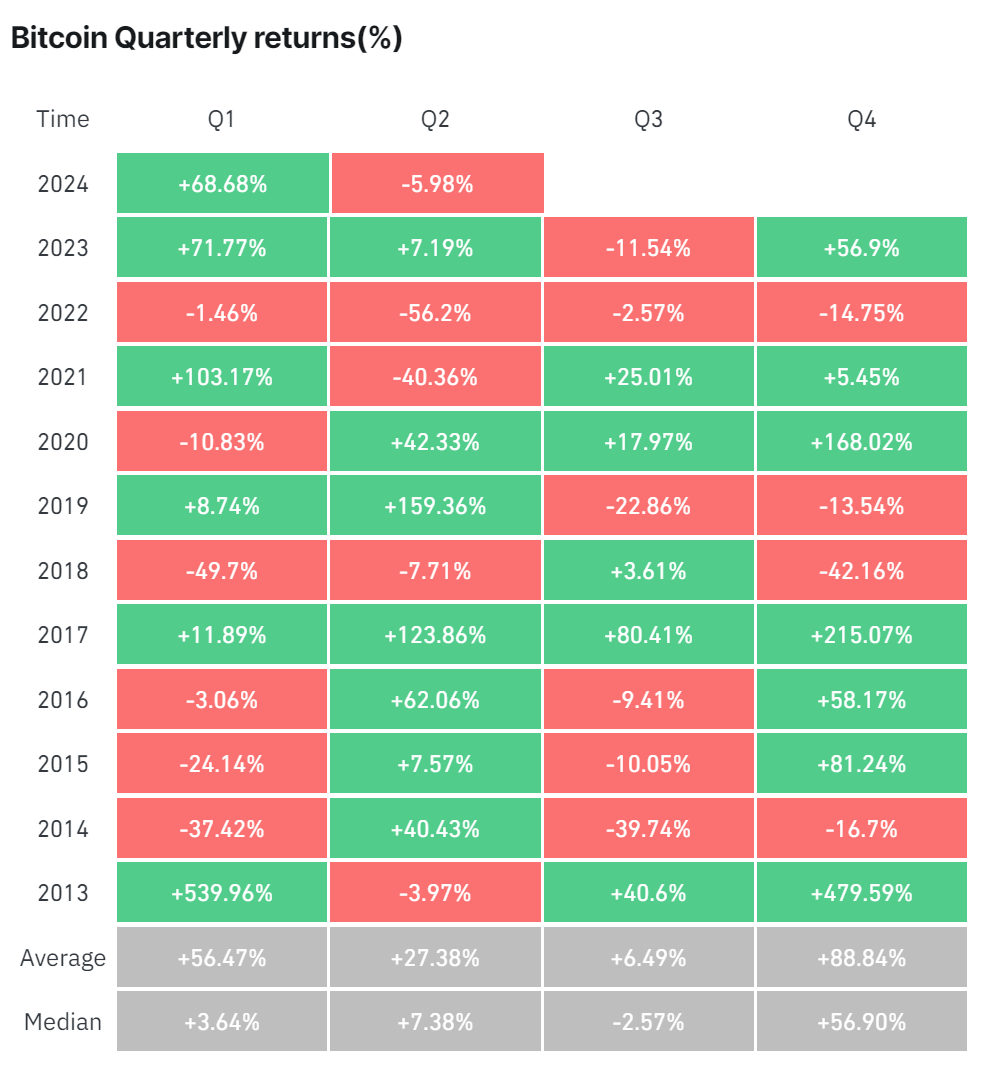
Let’s use the Bitcoin quarterly table as an example.
Q1 and Q4 often have high returns, like Q1 2024 at +68.68%.
Q2 and Q3 often show negative returns, like Q2 2024 at -5.76%.
Annual fluctuations are large, but there are more years with positive returns.
Long-term growth is significant, like Q1 2013 at +539.96%.
Predictions:
Q3 may have moderate positive returns, based on historical data.
Q4 is likely to have significant positive returns, as it usually performs best.
Note: Markets are volatile; historical data does not guarantee future performance.
3. Confused About Specific Crypto Concepts?
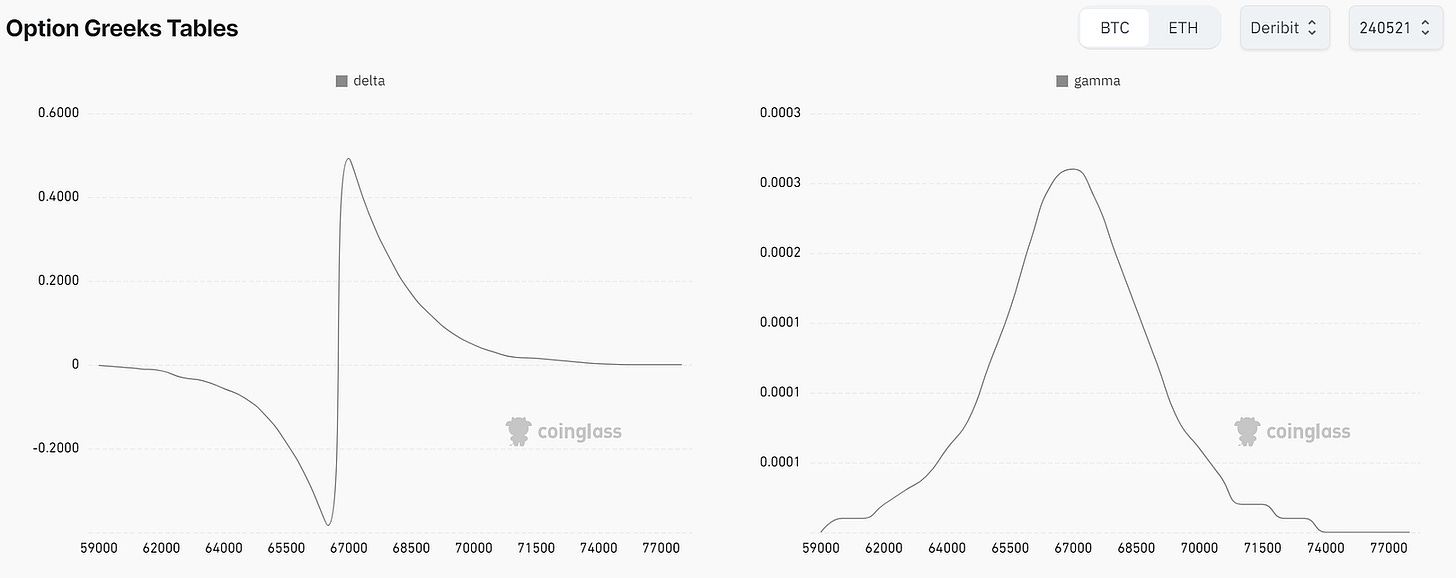
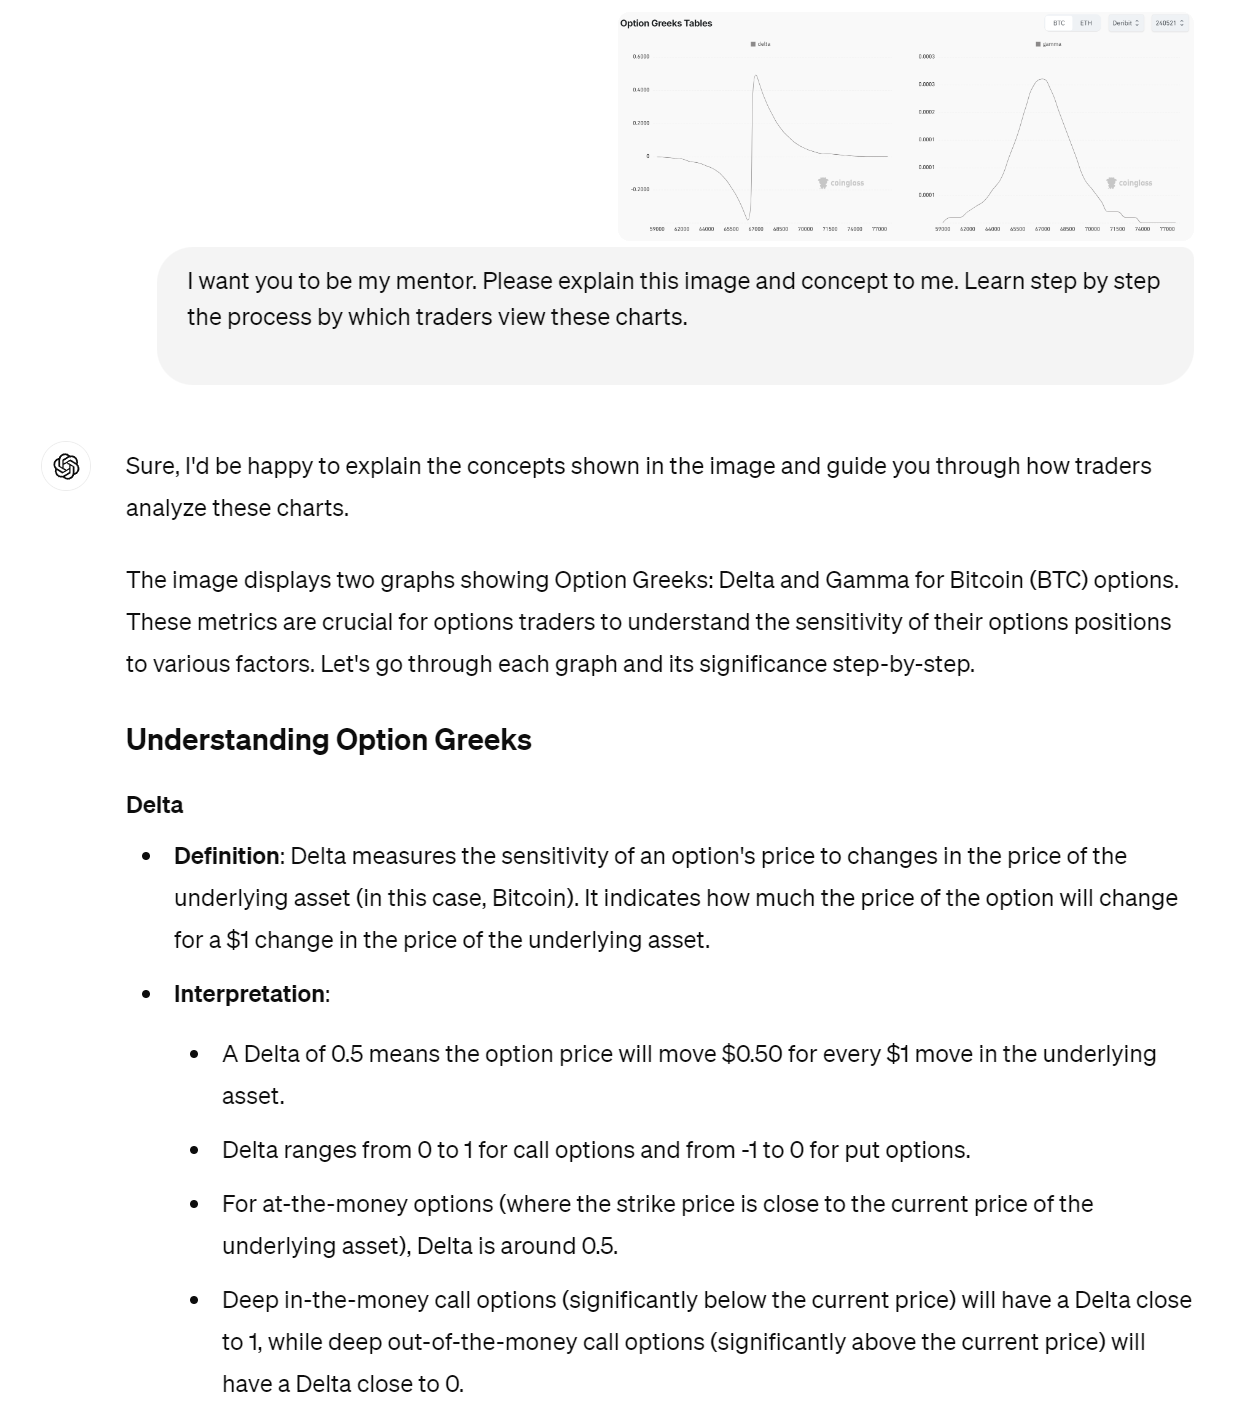
Use screenshots of graphs or charts and ask GPT-4o for explanations.
Prompt description: “I want you to be my mentor. Please explain this image and concept. Teach me step by step how traders view these charts.”
Summary of Analysis:
Delta shows how much an option’s value changes when the asset price changes. Gamma shows how fast Delta changes.
A high Delta means the option value changes a lot when the asset price moves.
Options with high Delta are good for short trades.
High Gamma means Delta and the option price changes quickly, which is risky.
When trading, first identify the underlying asset’s price. Then, use Delta and Gamma values to choose the right options strategy. Understanding Delta and Gamma helps make trading more precise!
If you have good ideas, feel free to share. For more examples, follow me.
Hi! My name is Meng. Thank you for reading and engaging with this piece. If you’re new here, make sure to follow me. (Tip: I’ll engage with, and support, your work. 🤫thank me later).


