How Large Language Models Generate Code Graphs to Aid Programming
Discover how code graphs and LLMs improve code analysis by mapping relationships between functions, variables, and classes for better code understanding.
Code graphs are the foundation of modern software, but as codebases grow in complexity, understanding and navigating them becomes more challenging.
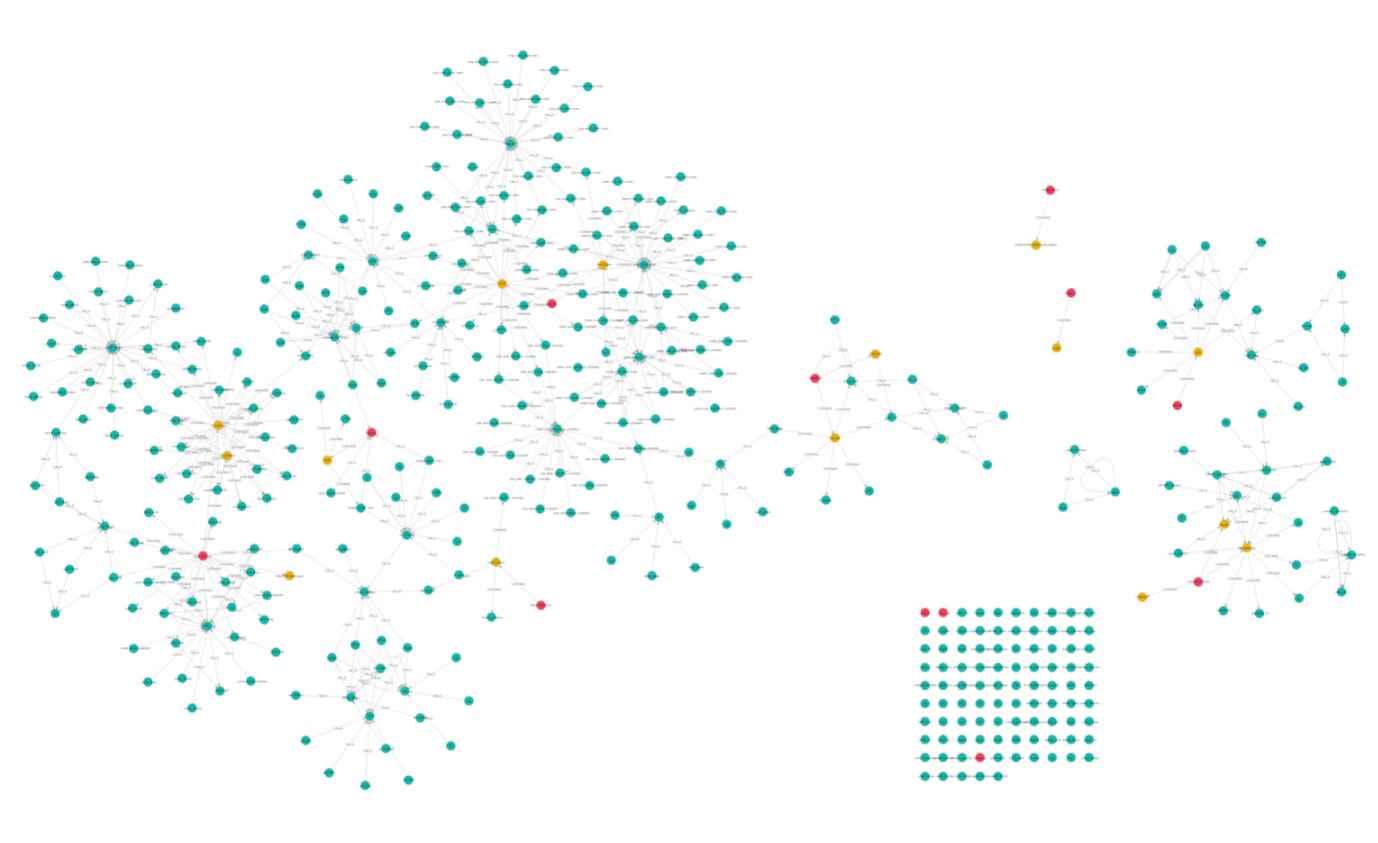
A code graph is a visual representation of a codebase that uses knowledge graphs and large language models (LLMs) to map relationships between code entities, such as functions, variables, and classes.
In this article, we’ll explore the core concepts of code graphs, how they are created, and how they enhance code analysis.
We’ll also introduce FalkorDB’s code graph tool, which generates a deployable code graph browser and query interface from any GitHub repository. Let’s dive in!
What is a Code Graph, and How Does it Improve Code Analysis?
A code graph visualizes a codebase as a knowledge graph, helping people explore entities (functions, variables, classes) and their relationships.
By mapping these connections, it's easier to understand the structure and flow of the code, identify issues, and improve overall quality.
The concept of representing code as a graph goes back to early software engineering, where researchers explored using graph-based techniques to model and analyze programs.
Modern code graphs combine knowledge graphs and LLMs, a recent development. Modern knowledge graph databases make it efficient to store, query, and visualize large-scale code graphs.
This capability enhances code understanding and offers language-agnostic benefits in code navigation:
Improved comprehension: Track data flow in functions and identify interconnected components.
Impact analysis: Assess the ripple effects of code changes and predict potential issues.
Auto-completion: Suggest related functions, variables, and types based on context.
Code search: Search not only by keywords but by understanding relationships between code elements.
Code graphs provide clear visualizations of complex code structures, making it easier to track execution paths, locate areas of high complexity, and facilitate better debugging and refactoring.
We’ve already created several example code graphs and visualizations in FalkorDB .


